Telegraf
Telegraf is a client for collecting metrics from many inputs and has support for sending it on to various outputs. It is plugin-driven for the collection and delivery of data, so it is easily configurable and customizable. Telegraf is compiled as a standalone binary, which means there are no external dependencies required to manage.
QuestDB supports ingesting from Telegraf over TCP. This page provides examples for collecting CPU and memory usage metrics using Telegraf and sends these metrics to a locally-running QuestDB instance for querying and visualization.
Prerequisites#
QuestDB must be running and accessible. You can do so from Docker, the binaries, or Homebrew for macOS users.
Telegraf can be installed using homebrew, docker, or directly as a binary. For more details, refer to the official Telegraf installation instructions.
Configuring Telegraf#
As Telegraf is a plugin-driven agent, the configuration file provided when Telegraf is launched will determine which metrics to collect, if and how processing of the metrics should be performed, and the destination outputs.
The default location that Telegraf can pick up configuration files is
/usr/local/etc/ on macOS and /etc/telegraf/ on Linux. After installation,
default configuration files are in the following locations:
- Homebrew install:
/usr/local/etc/telegraf.conf - Linux, Deb and RPM:
/etc/telegraf/telegraf.conf
Full configuration files for writing over TCP are provided below and can be placed in these directories and picked up by Telegraf. To view a comprehensive configuration file with example inputs and outputs, the following command can generate an example:
Example Inputs#
The examples on this page will use input plugins that read CPU and memory usage statistics of the host machine and send this to the outputs specified in the configuration file. The following snippet includes code comments which describe the inputs in more detail:
Writing to QuestDB over TCP#
QuestDB expects influx line protocol messages over TCP on port 9009. To change
the default port, see the
InfluxDB line protocol (TCP)
section of the server configuration page.
Create a new file named questdb_tcp.conf in one of the locations Telegraf can
load configuration files from and paste the following example:
Run Telegraf and specify this config file with TCP writer settings:
Telegraf should report the following if configured correctly:
Verifying the integration#
- Navigate to the QuestDB Web Console at http://127.0.0.1:9000/. The Schema Navigator in the top left should display two new tables:
cpugenerated frominputs.cpumemgenerated frominputs.mem
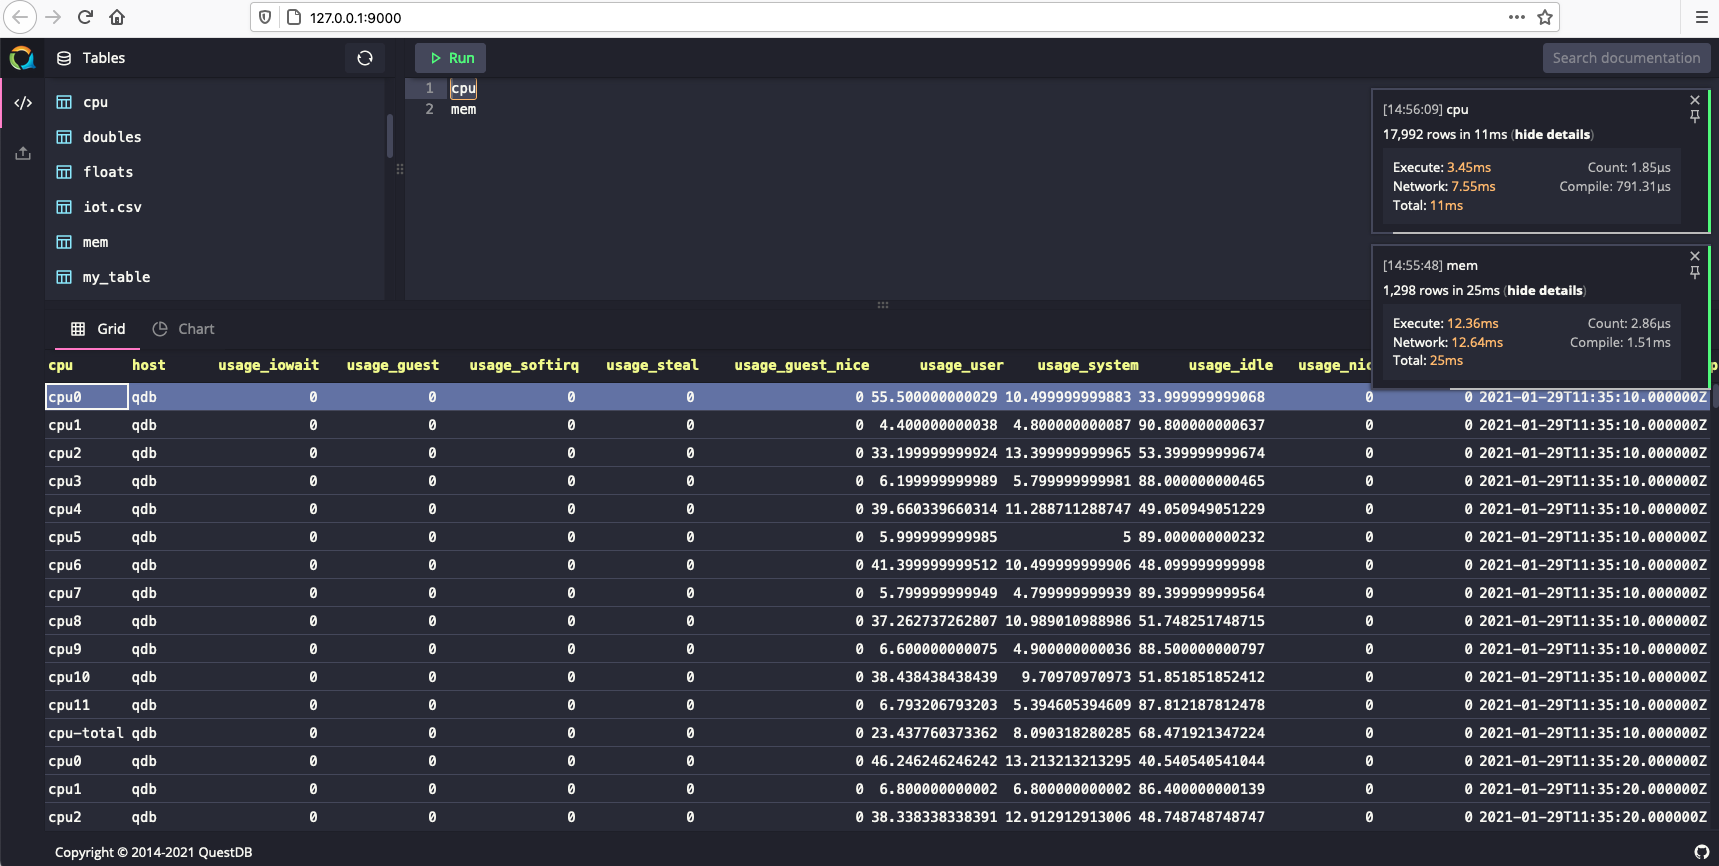
- Type
cpuin the query editor and click RUN
The cpu table will have a column for each metric collected by the Telegraf
plugin for monitoring memory:

Graphing system CPU#
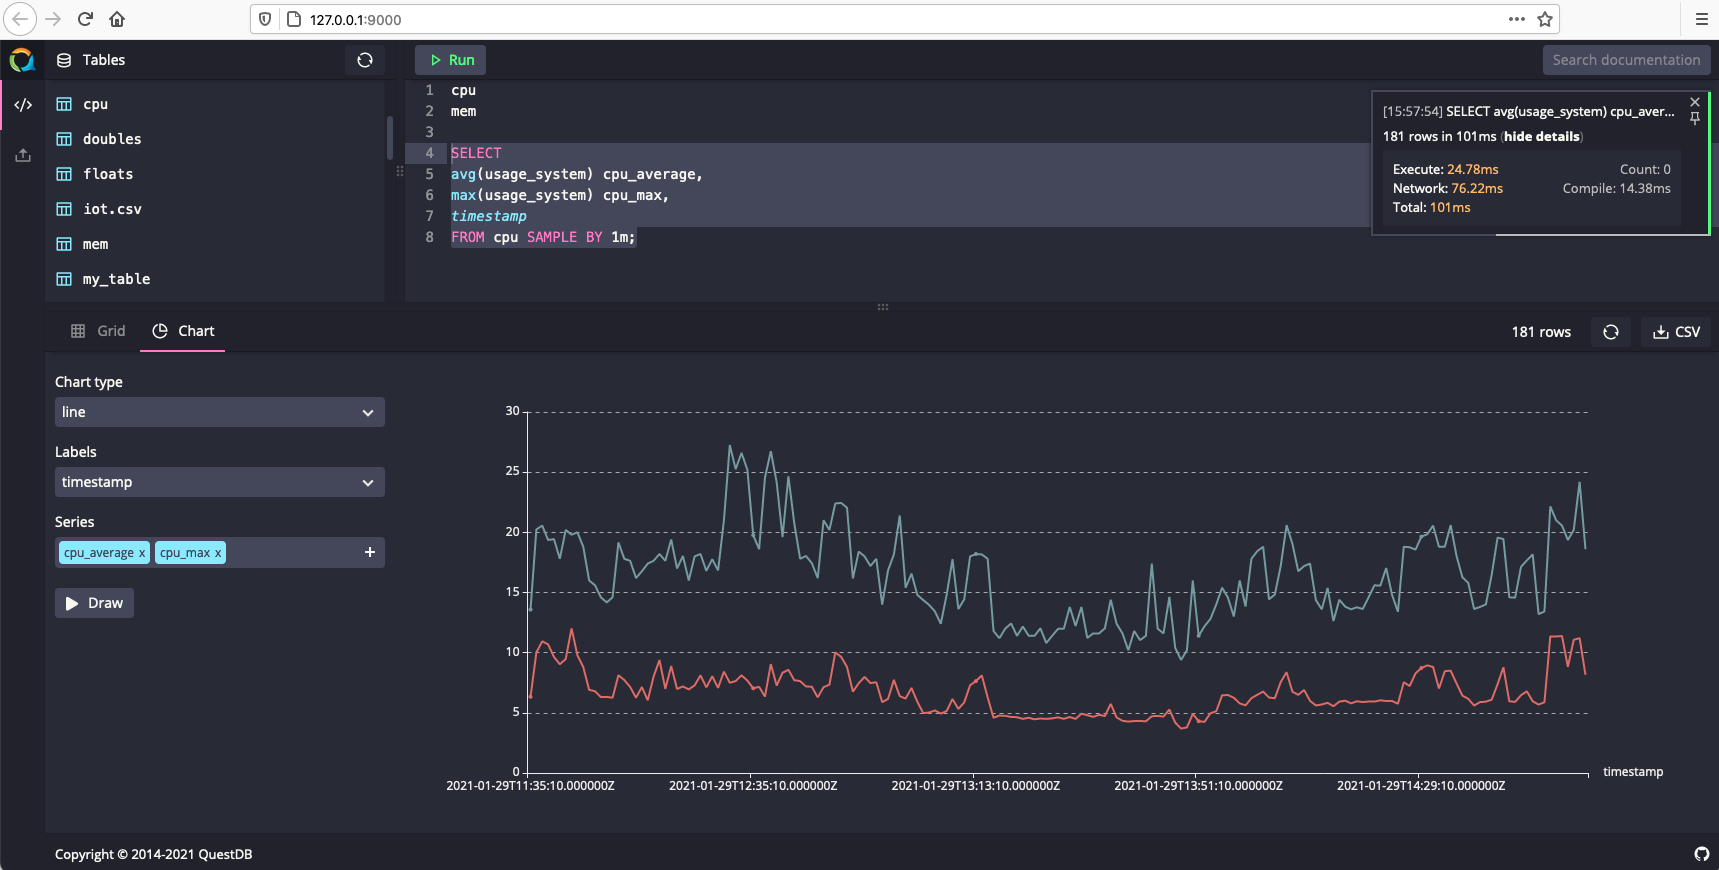
To create a graph that visualizes CPU usage over time, run the following example query:
Select the Chart tab and set the following values:
- Chart type line
- Labels timestamp
- Series cpu_average and cpu_max
